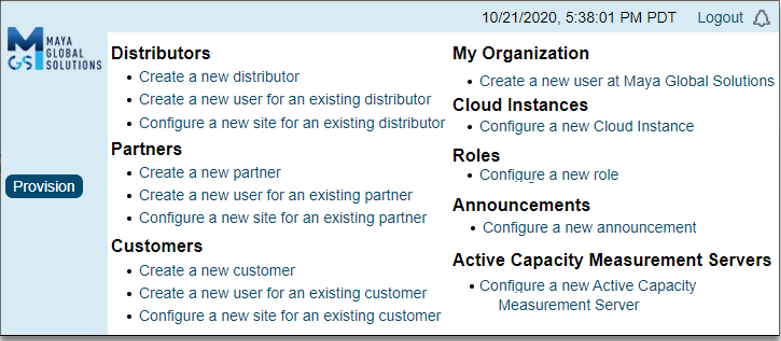
The Maya Control Center is a cloud-based management portal by which installers, admins, and operators can find everything they need in order to provision, configure, deploy, monitor and troubleshoot the Maya service.
The Maya Control Center consists of a database for configuration and site information and collects performance information from Maya devices. The Control Center portal can be accessed via web browser from the Internet by any user with a Control Center account.
Provisioning
Provisioning is how the Control Center adds people and Maya device to the portal. Control Center implements a hierarchical structure so Distributors see their Partners, and their Partners’ Customers. Partners see themselves and their customers, and finally Customers can see only themselves.

Configuring
Configuration covers basic Contact Information about people and organizations, Control Center Access, Default Networking Properties, Site/Device configuration and most importantly Interface Configuration. Configuring a site is where the Maya device information is entered, mode of operation is selected and IP addressing is configured. In installations using DHCP services, the IP addressing defaults for the WAN and LAN port should suffice. In more complicated networks, there are configuration parameters that allow an operator to configure the Maya device for the unique network requirements such as multiple WAN/LAN(s), Failover and Static IP Addressing to name a few. Control Center also keeps a version history of all configurations so you can “roll back” to a previous version if desired.

Deploying
Deployment is the process by which a Maya device connects to the Control Center and is sent its configuration. Devices can be pre-configured for a particular customer environment to ensure interoperability. On power up, Maya devices connect to the Control Center, Control Center validates that the device is authorized, checks for any updates to the software and awaits deployment by an operator. Once deployed the device configuration is downloaded.

Monitoring
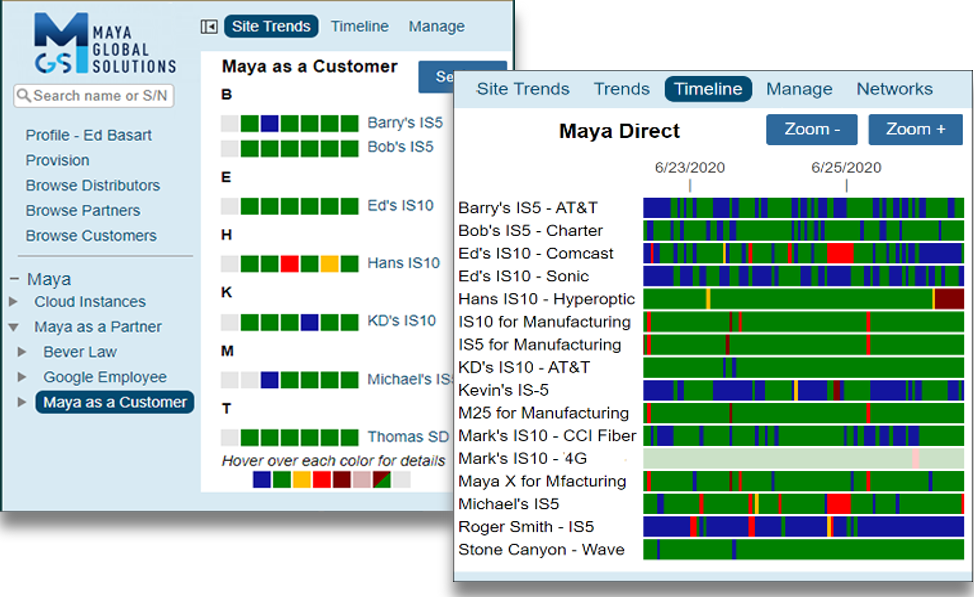
The Maya service is continuously monitoring all Maya devices. The Control Center shows the health of sites at the Customer level or at the Site level for the last 30 days. There is even a more detailed view called Timeline that shows network quality for each Interface at each site.

Visibility & TroubleshootingCharts show a timeline of the health of a site in great detail and is the major visibility tool in the Control Center. It shows inbound and outbound traffic for both high priority UDP packets and normal priority TCP packets. It also tracks network latency and jitter and shows any packet loss on each interface.
|
|
Control Center gives a network administrator the ability to troubleshoot a variety of networking issues in “two clicks”. Clicking on a yellow/red tile on a trend/timeline gets you the Chart at that time for that site. From there ISP outages, power failures or just fluctuating bandwidth can be easily identified.
|

